Linked from Deadspin: http://regressing.deadspin.com/char...ource=deadspin_facebook&utm_medium=socialflow
Kind of interesting.

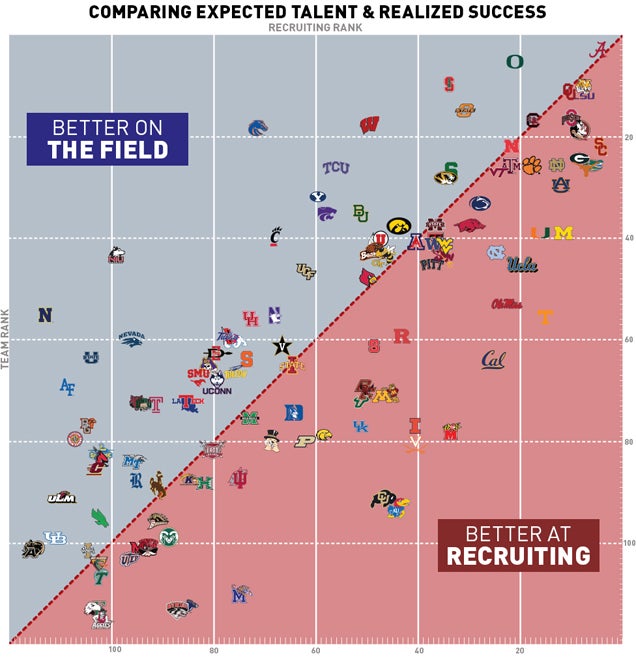
Interestign that the SEC on the whole does less wqith more from a recruiting ranking standpoint. Only Mizzu is clear of the line and: Georgia, T, Ole Miss, Uk, and Auburn are all well below it.
Our performance on the field has been worse than our recruiting.
It's like picking out the least rotten apple, but it is what it is. CU football has under-performed its talent in recent years.
It also looks like there's something off. P5 schools are under-represented on the "better on the field" side of the line.
Maybe the recruiting services over-rate P5 recruiting classes.
Maybe the ranking system under-rates the SOS of P5 programs.
Probably a combination of the two.
Take CU for example. If we took our same recruiting classes and played in the Sun Belt, Buffs would have been winning 8+ games a year during our recent struggles. Our exact same recruiting classes would have been ranked lower, though. But our power ranking would have been higher. That would have not meant that Hawkins and Embree were worse recruiters and better coaches, but I think this analysis would have painted them that way.
The chart basically shows that you perform as well as you recruit. Not many outliers.
Disagree but the article says it, there are out-liers like: Snyder, Boise, Wiscy, Stanford, TCU, Cincy and on on the up side. On the Down look at schools like Tenn/Cal/Memhis/us. We should be somewhere in the 60-80 range with how we've recruited ye we manged to touch the 100+ range, Cal and Tenn have pulled repeated top 25 classes of late and cant even finish .500
I'm not bored enough to do it but if you fit the data, you'd find that the line in the middle is probably pretty dead on. I doubt there are many programs that fall outside 2 standard deviations (there are some, of course).
I'm not bored enough to do it but if you fit the data, you'd find that the line in the middle is probably pretty dead on. I doubt there are many programs that fall outside 2 standard deviations (there are some, of course).
Too bad the study didn't go a step further and with a regression analysisWelcome to statistics 101. In a normal distribution, approx. 95% of observations always fall within 2 standard deviations of the mean. Because the way you calculate the standard deviation is based on the amount of variation in the data set. So, the more variation, the larger the standard deviation.
There is is a good linear correlation here, and also a very large amount of variance not explained by recruiting rank.
Be interesting to see a multiple regression. I'd like to see a few more independent variables, like AD budget, prior year record, SOS etc.Too bad the study didn't go a step further and with a regression analysis
The Massey rating incorporates SOS, but yeah there's a lot of other variables that could be significant that are missingBe interesting to see a multiple regression. I'd like to see a few more independent variables, like AD budget, prior year record, SOS etc.
The chart basically shows that you perform as well as you recruit. Not many outliers.
Be interesting to see a multiple regression. I'd like to see a few more independent variables, like AD budget, prior year record, SOS etc.
An interesting study would be to correlate the schools that see the majority of the top ends of their classes end up contributing and wins. Bama would be a good example of this. Off the top of my head I'd bet that over time Michigan State, Wisconsin, Stanford, and some others would head this list.
if you just graph the P5 teams and Norte Dame by total wins (especially conference wins) and recruiting ranks, I bet there are fewer teams far from the line. Teams like Colorado, Maryland, Illinois and Tennessee are going to have higher recruiting rankings than most MAC and MWC teams even though many of them will win more games and, as a result, get higher computer rankings.
Welcome to statistics 101. In a normal distribution, approx. 95% of observations always fall within 2 standard deviations of the mean. Because the way you calculate the standard deviation is based on the amount of variation in the data set. So, the more variation, the larger the standard deviation.
There is is a good linear correlation here, and also a very large amount of variance not explained by recruiting rank.
But it's almost like 90% of teams are within that range. Who would expect that?2 standard deviations is a pretty ****ing high bar.
How would you be able to gather that data objectively / not stacking the deck towards a favored conclusion?
.
I wish we were as average as Oregon State and Louisville.
That's kind of what I expect out of hcmm ceiling wise unless he proves he can recruit at a higher level. That's where cu needs to get to before taking the next step
I'm terrified that we will have 5 years of 7 and 8 win seasons, maybe hit 10 once and then decide we need a coach to get us to the next level so we part ways with Mac. We will then the wrong coach and suck again.
I'm glad you're so certainDon't worry, he'll leave for a better job before that happens.
I am more worried about him getting tired of losing and leaving for greener pasturesI'm terrified that we will have 5 years of 7 and 8 win seasons, maybe hit 10 once and then decide we need a coach to get us to the next level so we part ways with Mac. We will then the wrong coach and suck again.
